Visualization Tools
GIS and data analytics work together to transform complex information into clear, actionable insight. Through spatial analysis, reporting, and pattern recognition, data is translated into meaningful visuals and narratives. By integrating community, environmental, and infrastructure metrics, this approach reveals trends and relationships that support smarter planning and decision-making. For High Desert Community Consulting, these tools help communities understand their context, prioritize investments, and move projects forward with clarity and confidence.
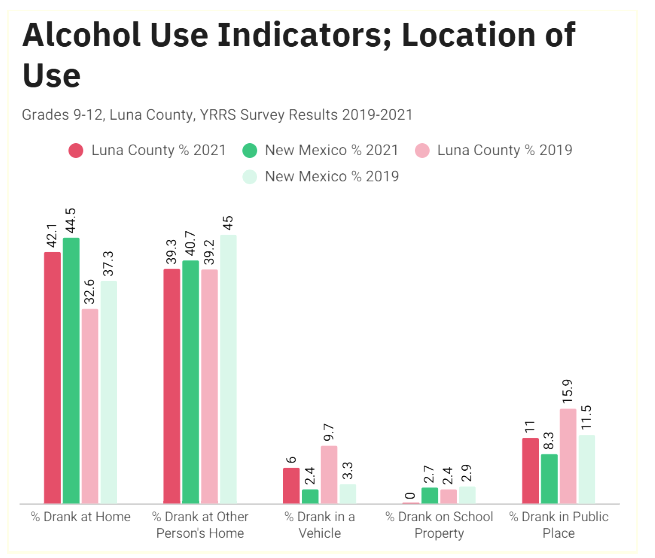
Data Visualization
Data visualization transforms high-level data into clear, compelling graphics that communicate complex ideas at a glance. By distilling large datasets into thoughtfully designed charts, maps, and visuals, this approach creates high-impact deliverables that are both accessible and persuasive. For High Desert Community Consulting, data visualization is a tool for storytelling—helping stakeholders quickly grasp key insights, align around priorities, and make informed decisions with confidence.